library("BIUMmisc")
#>
Compiled date: 2025-04-16
Last edited: 2025-04-16
library("DESeq2")
#> Loading required package: S4Vectors
#> Loading required package: stats4
#> Loading required package: BiocGenerics
#> Loading required package: generics
#>
#> Attaching package: 'generics'
#> The following objects are masked from 'package:base':
#>
#>     as.difftime, as.factor, as.ordered, intersect, is.element, setdiff,
#>     setequal, union
#>
#> Attaching package: 'BiocGenerics'
#> The following objects are masked from 'package:stats':
#>
#>     IQR, mad, sd, var, xtabs
#> The following objects are masked from 'package:base':
#>
#>     anyDuplicated, aperm, append, as.data.frame, basename, cbind,
#>     colnames, dirname, do.call, duplicated, eval, evalq, Filter, Find,
#>     get, grep, grepl, is.unsorted, lapply, Map, mapply, match, mget,
#>     order, paste, pmax, pmax.int, pmin, pmin.int, Position, rank,
#>     rbind, Reduce, rownames, sapply, saveRDS, table, tapply, unique,
#>     unsplit, which.max, which.min
#>
#> Attaching package: 'S4Vectors'
#> The following object is masked from 'package:utils':
#>
#>     findMatches
#> The following objects are masked from 'package:base':
#>
#>     expand.grid, I, unname
#> Loading required package: IRanges
#> Loading required package: GenomicRanges
#> Loading required package: GenomeInfoDb
#> Loading required package: SummarizedExperiment
#> Loading required package: MatrixGenerics
#> Loading required package: matrixStats
#>
#> Attaching package: 'MatrixGenerics'
#> The following objects are masked from 'package:matrixStats':
#>
#>     colAlls, colAnyNAs, colAnys, colAvgsPerRowSet, colCollapse,
#>     colCounts, colCummaxs, colCummins, colCumprods, colCumsums,
#>     colDiffs, colIQRDiffs, colIQRs, colLogSumExps, colMadDiffs,
#>     colMads, colMaxs, colMeans2, colMedians, colMins, colOrderStats,
#>     colProds, colQuantiles, colRanges, colRanks, colSdDiffs, colSds,
#>     colSums2, colTabulates, colVarDiffs, colVars, colWeightedMads,
#>     colWeightedMeans, colWeightedMedians, colWeightedSds,
#>     colWeightedVars, rowAlls, rowAnyNAs, rowAnys, rowAvgsPerColSet,
#>     rowCollapse, rowCounts, rowCummaxs, rowCummins, rowCumprods,
#>     rowCumsums, rowDiffs, rowIQRDiffs, rowIQRs, rowLogSumExps,
#>     rowMadDiffs, rowMads, rowMaxs, rowMeans2, rowMedians, rowMins,
#>     rowOrderStats, rowProds, rowQuantiles, rowRanges, rowRanks,
#>     rowSdDiffs, rowSds, rowSums2, rowTabulates, rowVarDiffs, rowVars,
#>     rowWeightedMads, rowWeightedMeans, rowWeightedMedians,
#>     rowWeightedSds, rowWeightedVars
#> Loading required package: Biobase
#> Welcome to Bioconductor
#>
#>     Vignettes contain introductory material; view with
#>     'browseVignettes()'. To cite Bioconductor, see
#>     'citation("Biobase")', and for packages 'citation("pkgname")'.
#>
#> Attaching package: 'Biobase'
#> The following object is masked from 'package:MatrixGenerics':
#>
#>     rowMedians
#> The following objects are masked from 'package:matrixStats':
#>
#>     anyMissing, rowMedians
library("topGO")
#> Loading required package: graph
#> Loading required package: GO.db
#> Loading required package: AnnotationDbi
#> Loading required package: SparseM
#>
#> groupGOTerms:    GOBPTerm, GOMFTerm, GOCCTerm environments built.
#>
#> Attaching package: 'topGO'
#> The following object is masked from 'package:IRanges':
#>
#>     members
library("org.Hs.eg.db")
#>
# library("pcaExplorer")
# library("ideal")
library("GeneTonic")
#> Welcome to GeneTonic v3.1.2
#>
#> If you use GeneTonic in your work, please cite:
#>
#>   GeneTonic: an R/Bioconductor package for streamlining the interpretation of RNA-seq data
#>   Federico Marini, Annekathrin Ludt, Jan Linke, Konstantin Strauch
#>   BMC Bioinformatics, 2021 - https://doi.org/10.1186/s12859-021-04461-5
#> and/or (if adopting the series of protocols as a whole)
#>   Interactive and Reproducible Workflows for Exploring and Modeling RNA-seq Data with pcaExplorer, ideal, and GeneTonic
#>   Annekathrin Ludt, Arsenij Ustjanzew, Harald Binder, Konstantin Strauch, Federico Marini
#>   Current Protocols, 2022 - https://doi.org/10.1002/cpz1.411
Before running DE steps
- Load the expression data as
DESeqDataSetobject and create the associated annotation table.
Similar to Basic Protocol 3, load first the required packages, and create the fundamentalDESeqDataSetobject to be used for the analysis (using ENSEMBL identifiers) - optionally, one can filter the set of lowly expressed genes as specified in the chunk below. Generate the corresponding annotation table fordds_macrophage, and store that asanno_df.
# Loading the packages
library("pcaExplorer")
#> Welcome to pcaExplorer v3.1.1
#>
#> If you use pcaExplorer in your work, please cite:
#>
#> pcaExplorer: an R/Bioconductor package for interacting with RNA-seq principal components
#> Federico Marini, Harald Binder
#> BMC Bioinformatics, 2019 - https://doi.org/10.1186/s12859-019-2879-1
library("ideal")
#> Welcome to ideal v2.1.1
#>
#> If you use ideal in your work, please cite:
#>
#> ideal: an R/Bioconductor package for Interactive Differential Expression Analysis
#> Federico Marini, Jan Linke, Harald Binder
#> BMC Bioinformatics, 2020 - https://doi.org/10.1186/s12859-020-03819-5
#>
#> Attaching package: 'ideal'
#> The following object is masked from 'package:BIUMmisc':
#>
#>     sepguesser
library("GeneTonic")

# Loading the data
library("macrophage")
library("DESeq2")
data("gse", package = "macrophage")
dds_macrophage <- DESeqDataSet(gse, design = ~line + condition)
#> using counts and average transcript lengths from tximeta


# one can also now use

dds_macrophage <- dds_gencode_to_ensembl(dds_macrophage)


# Changing the ids, removing the GENCODE-specific suffix
# rownames(dds_macrophage) <- substr(rownames(dds_macrophage), 1, 15)
# dds_macrophage


# Filtering low expressed features
keep <- rowSums(counts(dds_macrophage) >= 10) >= 6
dds_macrophage <- dds_macrophage[keep, ]
dds_macrophage
#> class: DESeqDataSet
#> dim: 17806 24
#> metadata(7): tximetaInfo quantInfo ... txdbInfo version
#> assays(3): counts abundance avgTxLength
#> rownames(17806): ENSG00000000003 ENSG00000000419 ... ENSG00000285982
#>   ENSG00000285994
#> rowData names(3): gene_id SYMBOL gencode_id
#> colnames(24): SAMEA103885102 SAMEA103885347 ... SAMEA103885308
#>   SAMEA103884949
#> colData names(15): names sample_id ... condition line
# Construct the annotation data frame
library("org.Hs.eg.db")
anno_df <- get_annotation_orgdb(dds = dds_macrophage,
                                orgdb_species = "org.Hs.eg.db",
                                idtype = "ENSEMBL")
#> 'select()' returned 1:many mapping between keys and columns
library("biomaRt")
mart <- useMart(biomart="ENSEMBL_MART_ENSEMBL", dataset="hsapiens_gene_ensembl")

anns <- getBM(attributes = c("ensembl_gene_id", "external_gene_name", "description"),
              filters = "ensembl_gene_id",
              # filters = "external_gene_name",
              values = rownames(dds_macrophage),
              mart = mart)
plot_totcounts(dds_macrophage, group = "condition")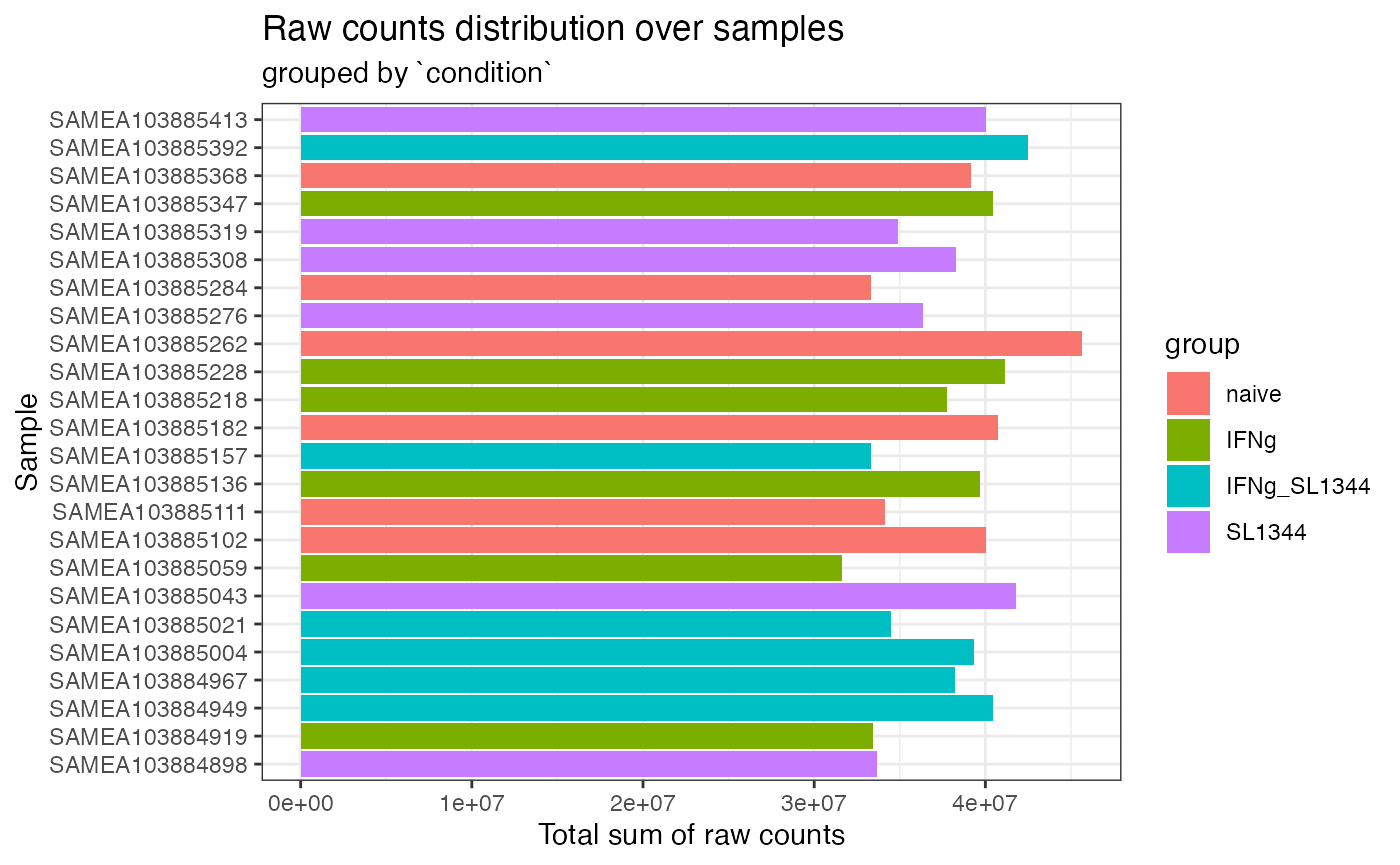
extended_anno <- fortify_annotations(anno_df_1 = anno_df,
                                     anno_df_2 = anns,
                                     dds = dds_macrophage)
#> Found 2238 features with value NA in column gene_name (anno_df_1)
#> Found 226 features with value NA in column external_gene_name (anno_df_2)
#> Trying to resolve missing info in gene_name (anno_df_1) with info from external_gene_name (anno_df_2)...
#> Found 226 features with value NA in the resolved gene name column
#> You might want to add/edit additionally this annotation table...
#> Updated rowData slot of the dds object by adding columns: anno_gene_id, anno_gene_name, anno_description

extended_anno$anno_df |> head()
#>                         gene_id gene_name external_gene_name
#> ENSG00000000003 ENSG00000000003    TSPAN6             TSPAN6
#> ENSG00000000419 ENSG00000000419      DPM1               DPM1
#> ENSG00000000457 ENSG00000000457     SCYL3              SCYL3
#> ENSG00000000460 ENSG00000000460     FIRRM              FIRRM
#> ENSG00000000938 ENSG00000000938       FGR                FGR
#> ENSG00000000971 ENSG00000000971       CFH                CFH
#>                                                                                                    description
#> ENSG00000000003                                              tetraspanin 6 [Source:HGNC Symbol;Acc:HGNC:11858]
#> ENSG00000000419 dolichyl-phosphate mannosyltransferase subunit 1, catalytic [Source:HGNC Symbol;Acc:HGNC:3005]
#> ENSG00000000457                                   SCY1 like pseudokinase 3 [Source:HGNC Symbol;Acc:HGNC:19285]
#> ENSG00000000460  FIGNL1 interacting regulator of recombination and mitosis [Source:HGNC Symbol;Acc:HGNC:25565]
#> ENSG00000000938              FGR proto-oncogene, Src family tyrosine kinase [Source:HGNC Symbol;Acc:HGNC:3697]
#> ENSG00000000971                                         complement factor H [Source:HGNC Symbol;Acc:HGNC:4883]
extended_anno$dds
#> class: DESeqDataSet
#> dim: 17806 24
#> metadata(7): tximetaInfo quantInfo ... txdbInfo version
#> assays(3): counts abundance avgTxLength
#> rownames(17806): ENSG00000000003 ENSG00000000419 ... ENSG00000285982
#>   ENSG00000285994
#> rowData names(6): gene_id SYMBOL ... anno_gene_name anno_description
#> colnames(24): SAMEA103885102 SAMEA103885347 ... SAMEA103885308
#>   SAMEA103884949
#> colData names(15): names sample_id ... condition line
tbl_normcounts <- deseq_normcounts_with_info(dds = dds_macrophage,
                                             extended_anno_df = extended_anno$anno_df)
#> using 'avgTxLength' from assays(dds), correcting for library size

tbl_TPMs <- deseq_tpm_with_info(dds = dds_macrophage,
                                extended_anno_df = extended_anno$anno_df)
Running the DE steps
Creating the DE results themselves…
dds_macrophage
#> class: DESeqDataSet
#> dim: 17806 24
#> metadata(7): tximetaInfo quantInfo ... txdbInfo version
#> assays(3): counts abundance avgTxLength
#> rownames(17806): ENSG00000000003 ENSG00000000419 ... ENSG00000285982
#>   ENSG00000285994
#> rowData names(3): gene_id SYMBOL gencode_id
#> colnames(24): SAMEA103885102 SAMEA103885347 ... SAMEA103885308
#>   SAMEA103884949
#> colData names(15): names sample_id ... condition line
design(dds_macrophage)
#> ~line + condition
dds_macrophage <- DESeq(dds_macrophage)
#> estimating size factors
#> using 'avgTxLength' from assays(dds), correcting for library size
#> estimating dispersions
#> gene-wise dispersion estimates
#> mean-dispersion relationship
#> final dispersion estimates
#> fitting model and testing

resultsNames(dds_macrophage)
#> [1] "Intercept"                      "line_eiwy_1_vs_diku_1"
#> [3] "line_fikt_3_vs_diku_1"          "line_ieki_2_vs_diku_1"
#> [5] "line_podx_1_vs_diku_1"          "line_qaqx_1_vs_diku_1"
#> [7] "condition_IFNg_vs_naive"        "condition_IFNg_SL1344_vs_naive"
#> [9] "condition_SL1344_vs_naive"

myresuSet_macrophage <- list()

myresuSet_macrophage <-
  create_DEresults(resuSet = myresuSet_macrophage,
                   dds_obj = dds_macrophage,
                   contrast_name = "condition_IFNg_vs_naive",
                   FDR = 0.05,
                   extended_anno_df = extended_anno$anno_df,
                   species = "Homo_sapiens"
                   )
#> Storing set of results in the element `condition_IFNg_vs_naive`...
#> Extracting results...
#> Performing LFC shrinkage...
#> using 'apeglm' for LFC shrinkage. If used in published research, please cite:
#>     Zhu, A., Ibrahim, J.G., Love, M.I. (2018) Heavy-tailed prior distributions for
#>     sequence count data: removing the noise and preserving large differences.
#>     Bioinformatics. https://doi.org/10.1093/bioinformatics/bty895
#> Summary MAplot...
#> Extracting tables...
#> Extracting DEtables...
#> Generating interactive DEtable...

myresuSet_macrophage <-
  create_DEresults(resuSet = myresuSet_macrophage,
                   dds_obj = dds_macrophage,
                   contrast_name = "condition_IFNg_vs_naive",
                   lfc_threshold = 0.6,
                   FDR = 0.05,
                   extended_anno_df = extended_anno$anno_df,
                   species = "Homo_sapiens",
                   name_res_entry = "ifng-naive-lfc0.6"
                   )
#> Storing set of results in the element `ifng-naive-lfc0.6`...
#> Extracting results...
#> Performing LFC shrinkage...
#> using 'apeglm' for LFC shrinkage. If used in published research, please cite:
#>     Zhu, A., Ibrahim, J.G., Love, M.I. (2018) Heavy-tailed prior distributions for
#>     sequence count data: removing the noise and preserving large differences.
#>     Bioinformatics. https://doi.org/10.1093/bioinformatics/bty895
#> Summary MAplot...
#> Extracting tables...
#> Extracting DEtables...
#> Generating interactive DEtable...

myresuSet_macrophage <-
  create_DEresults(resuSet = myresuSet_macrophage,
                   dds_obj = dds_macrophage,
                   contrast_name = "condition_IFNg_vs_naive",
                   lfc_threshold = 1,
                   FDR = 0.05,
                   extended_anno_df = extended_anno$anno_df,
                   species = "Homo_sapiens",
                   name_res_entry = "ifng-naive-lfc1"
                   )
#> Storing set of results in the element `ifng-naive-lfc1`...
#> Extracting results...
#> Performing LFC shrinkage...
#> using 'apeglm' for LFC shrinkage. If used in published research, please cite:
#>     Zhu, A., Ibrahim, J.G., Love, M.I. (2018) Heavy-tailed prior distributions for
#>     sequence count data: removing the noise and preserving large differences.
#>     Bioinformatics. https://doi.org/10.1093/bioinformatics/bty895
#> Summary MAplot...
#> Extracting tables...
#> Extracting DEtables...
#> Generating interactive DEtable...
genes_of_interest <- c(
  "ENSG00000125347",   # IRF1
  "ENSG00000110944",   # IL23A
  "ENSG00000084636",   # COL16A1
  "ENSG00000172399"    # MYOZ2
)

plot_ma(res_obj = myresuSet_macrophage$`ifng-naive-lfc1`$res_DESeq,
        intgenes = genes_of_interest)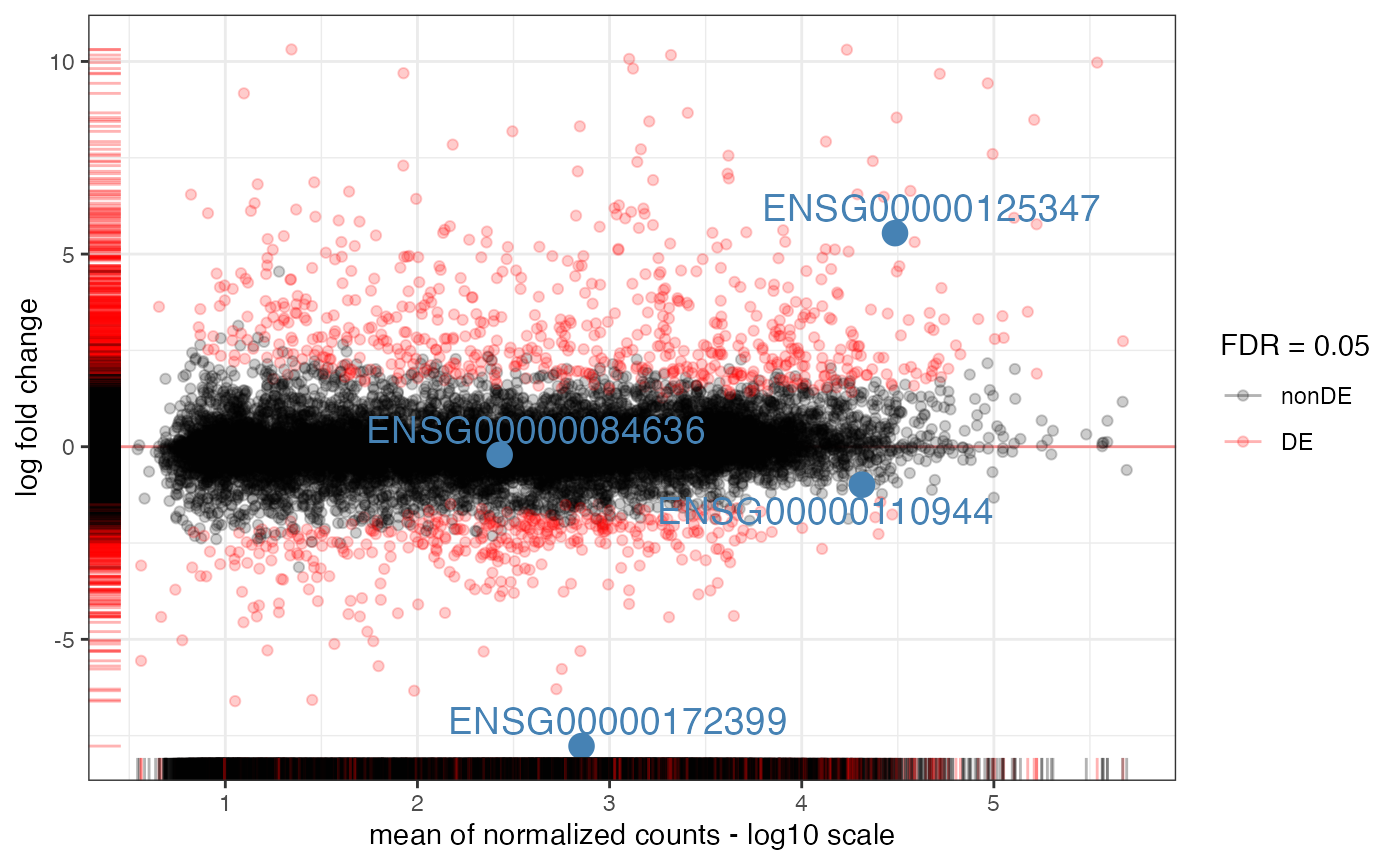
plot_volcano(res_obj = myresuSet_macrophage$`ifng-naive-lfc1`$res_DESeq,
             ylim_up = 40,
             intgenes = genes_of_interest)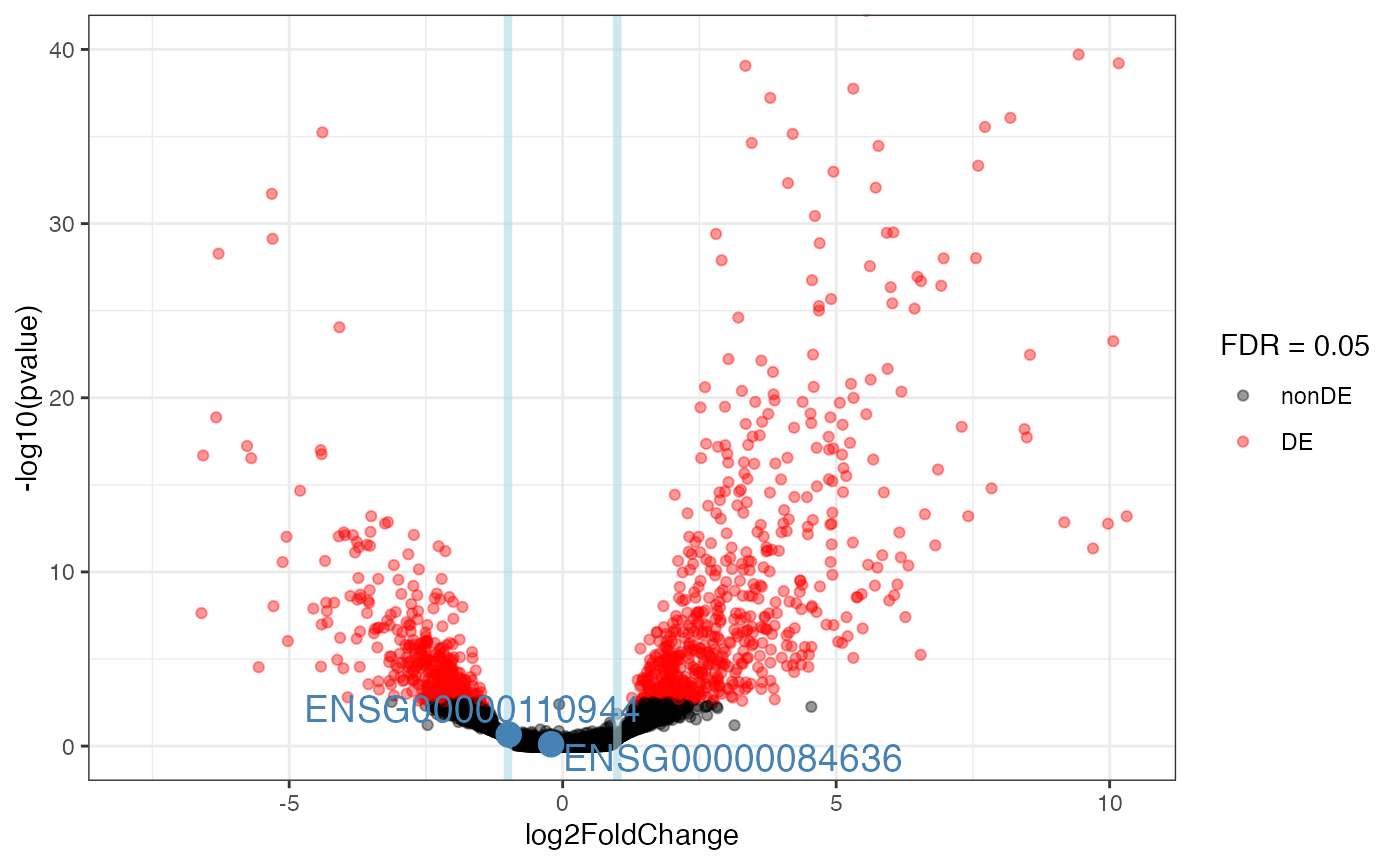
# TODO: adjust the y limit
# TODO: add text ready to be ggplotlified?
After the DE steps: functional enrichment
extended_anno_df <- extended_anno$anno_df
expressedInAssay <- (rowSums(assay(dds_macrophage))>0)
geneUniverseExprENS <- rownames(dds_macrophage)[expressedInAssay]
geneUniverseExpr <- extended_anno_df$gene_name[match(geneUniverseExprENS, extended_anno_df$gene_id)]
We iterate on all contrasts in the myresuSet object
for(i in names(myresuSet_macrophage)) {
  message(i)
  if(nrow(myresuSet_macrophage[[i]][["tbl_res_DE"]]) > 0) {
  myresuSet_macrophage[[i]][["topGO_tbl"]] <-
    topGOtable(DEgenes = myresuSet_macrophage[[i]][["tbl_res_DE"]]$gene_name,
               BGgenes = geneUniverseExpr,
               ontology = "BP",
               geneID = "symbol",
               addGeneToTerms=TRUE,
               topTablerows = 500,
               mapping = "org.Hs.eg.db")
  }
}
#> condition_IFNg_vs_naive
#> Warning in topGOtable(DEgenes = myresuSet_macrophage[[i]][["tbl_res_DE"]]$gene_name, : Please use `mosdef::run_topGO()` in replacement of the `topGOtable()` function, originally located in the pcaExplorer package.
#> Check the manual page for `?mosdef::run_topGO()` to see the details on how to use it, e.g. refer to the new parameter definition and naming
#> Your dataset has 6079 DE genes.
#> You selected 6079 (100.00%) genes for the enrichment analysis.
#> Warning in mosdef::run_topGO(de_genes = DEgenes, bg_genes = BGgenes, annot =
#> annot, : NAs introduced by coercion
#> 6073 GO terms were analyzed. Not all of them are significantly enriched.
#> We suggest further subsetting the output list by for example:
#> using a pvalue cutoff in the column:
#> 'p.value_elim'.
#> ifng-naive-lfc0.6
#> Warning in topGOtable(DEgenes = myresuSet_macrophage[[i]][["tbl_res_DE"]]$gene_name, : Please use `mosdef::run_topGO()` in replacement of the `topGOtable()` function, originally located in the pcaExplorer package.
#> Check the manual page for `?mosdef::run_topGO()` to see the details on how to use it, e.g. refer to the new parameter definition and naming
#> Your dataset has 1870 DE genes.
#> You selected 1870 (100.00%) genes for the enrichment analysis.
#> Warning in mosdef::run_topGO(de_genes = DEgenes, bg_genes = BGgenes, annot =
#> annot, : NAs introduced by coercion
#> 6073 GO terms were analyzed. Not all of them are significantly enriched.
#> We suggest further subsetting the output list by for example:
#> using a pvalue cutoff in the column:
#> 'p.value_elim'.
#> ifng-naive-lfc1
#> Warning in topGOtable(DEgenes = myresuSet_macrophage[[i]][["tbl_res_DE"]]$gene_name, : Please use `mosdef::run_topGO()` in replacement of the `topGOtable()` function, originally located in the pcaExplorer package.
#> Check the manual page for `?mosdef::run_topGO()` to see the details on how to use it, e.g. refer to the new parameter definition and naming
#> Your dataset has 1024 DE genes.
#> You selected 1024 (100.00%) genes for the enrichment analysis.
#> Warning in mosdef::run_topGO(de_genes = DEgenes, bg_genes = BGgenes, annot =
#> annot, : NAs introduced by coercion
#> 6073 GO terms were analyzed. Not all of them are significantly enriched.
#> We suggest further subsetting the output list by for example:
#> using a pvalue cutoff in the column:
#> 'p.value_elim'.
library("clusterProfiler")
#> clusterProfiler v4.15.2 Learn more at https://yulab-smu.top/contribution-knowledge-mining/
#>
#> Please cite:
#>
#> T Wu, E Hu, S Xu, M Chen, P Guo, Z Dai, T Feng, L Zhou, W Tang, L Zhan,
#> X Fu, S Liu, X Bo, and G Yu. clusterProfiler 4.0: A universal
#> enrichment tool for interpreting omics data. The Innovation. 2021,
#> 2(3):100141
#>
#> Attaching package: 'clusterProfiler'
#> The following object is masked from 'package:biomaRt':
#>
#>     select
#> The following object is masked from 'package:AnnotationDbi':
#>
#>     select
#> The following object is masked from 'package:IRanges':
#>
#>     slice
#> The following object is masked from 'package:S4Vectors':
#>
#>     rename
#> The following object is masked from 'package:stats':
#>
#>     filter
for(i in names(myresuSet_macrophage)) {
  message(i)
  if(nrow(myresuSet_macrophage[[i]][["tbl_res_DE"]]) > 0) {
    myresuSet_macrophage[[i]][["clupro_tbl"]] <-
      enrichGO(
        gene = myresuSet_macrophage[[i]][["tbl_res_DE"]]$gene_name,
        universe      = geneUniverseExpr,
        keyType       = "SYMBOL",
        OrgDb         = org.Hs.eg.db,
        ont           = "BP",
        pAdjustMethod = "BH",
        pvalueCutoff  = 0.01,
        qvalueCutoff  = 0.05,
        readable      = FALSE)
  }
}
#> condition_IFNg_vs_naive
#> ifng-naive-lfc0.6
#> ifng-naive-lfc1
Wrapping up a DE report
transforming this into a gtl
gtl_macs_ifng_naive <- resuset_to_gtl(myresuSet_macrophage,
result_name = "ifng-naive-lfc0.6",
dds = dds_macrophage,
anno_df = extended_anno_df)
#> Found 6073 gene sets in `topGOtableResult` object.
#> Converting for usage in GeneTonic...
#> ---------------------------------
#> ----- GeneTonicList object ------
#> ---------------------------------
#>
#> ----- dds object -----
#> Providing an expression object (as DESeqDataset) of 17806 features over 24 samples
#>
#> ----- res_de object -----
#> Providing a DE result object (as DESeqResults), 17806 features tested, 1870 found as DE
#> Upregulated: 1109
#> Downregulated: 761
#>
#> ----- res_enrich object -----
#> Providing an enrichment result object, 6073 reported
#>
#> ----- annotation_obj object -----
#> Providing an annotation object of 17806 features with information on 4 identifier types
describe_gtl(gtl_macs_ifng_naive)
#> [1] "---------------------------------\n"
#> [2] "----- GeneTonicList object ------\n"
#> [3] "---------------------------------\n"
#> [4] "\n----- dds object -----\n"
#> [5] "Providing an expression object (as DESeqDataset) of 17806 features over 24 samples\n"
#> [6] "\n----- res_de object -----\n"
#> [7] "Providing a DE result object (as DESeqResults), 17806 features tested, 1870 found as DE\n"
#> [8] "Upregulated: 1109\n"
#> [9] "Downregulated: 761\n"
#> [10] "\n----- res_enrich object -----\n"
#> [11] "Providing an enrichment result object, 6073 reported\n"
#> [12] "\n----- annotation_obj object -----\n"
#> [13] "Providing an annotation object of 17806 features with information on 4 identifier types\n"
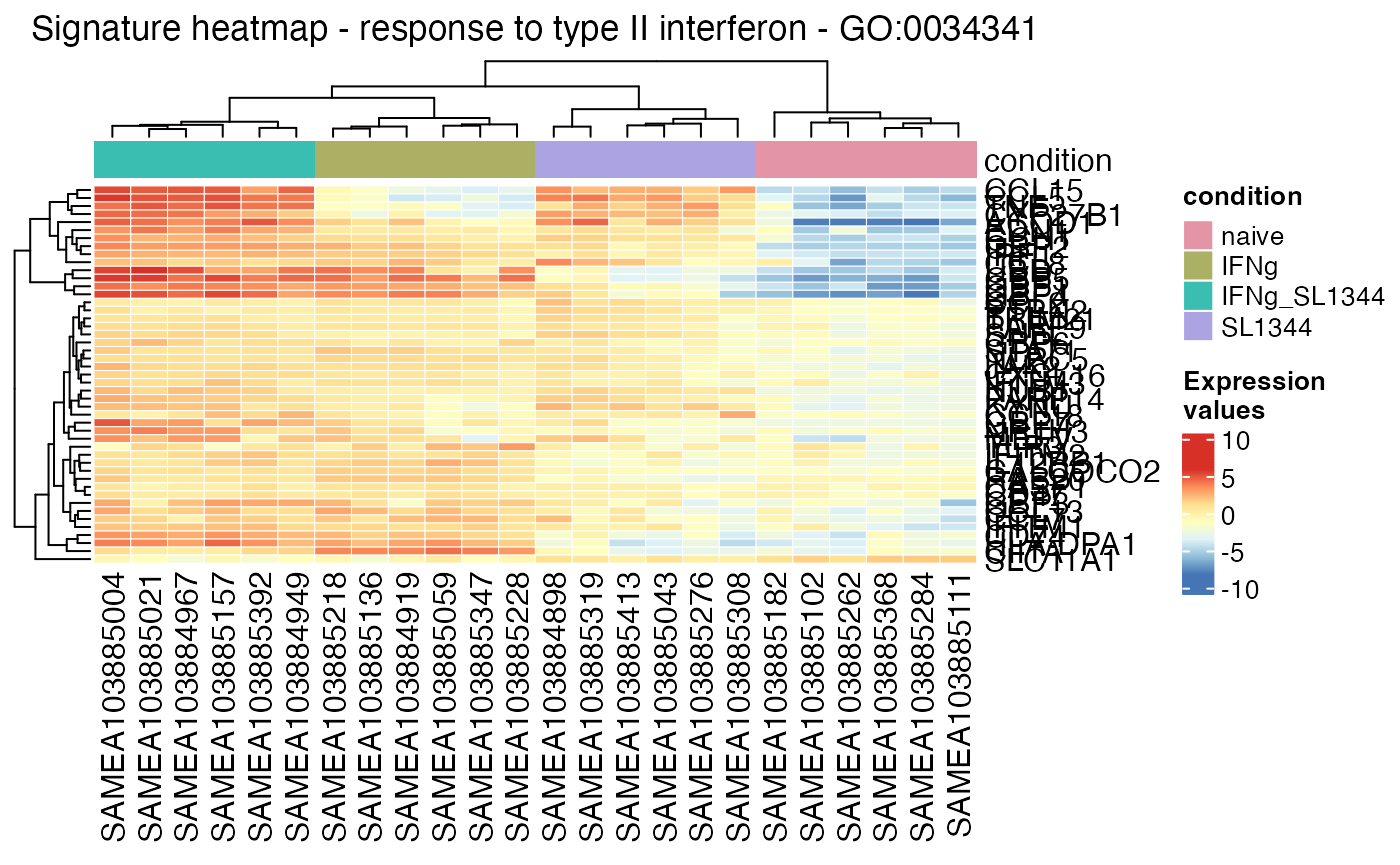
vst_macrophage <- vst(dds_macrophage)
gs_heatmap(se = vst_macrophage,
gtl = gtl_macs_ifng_naive,
geneset_id = "GO:0034341",
cluster_columns = TRUE,
cluster_rows = TRUE,
anno_col_info = "condition"
)
signature_volcano(gtl = gtl_macs_ifng_naive,
                  geneset_id = "GO:0034341",
                  FDR = 0.05
)
#> Warning: ggrepel: 21 unlabeled data points (too many overlaps). Consider
#> increasing max.overlaps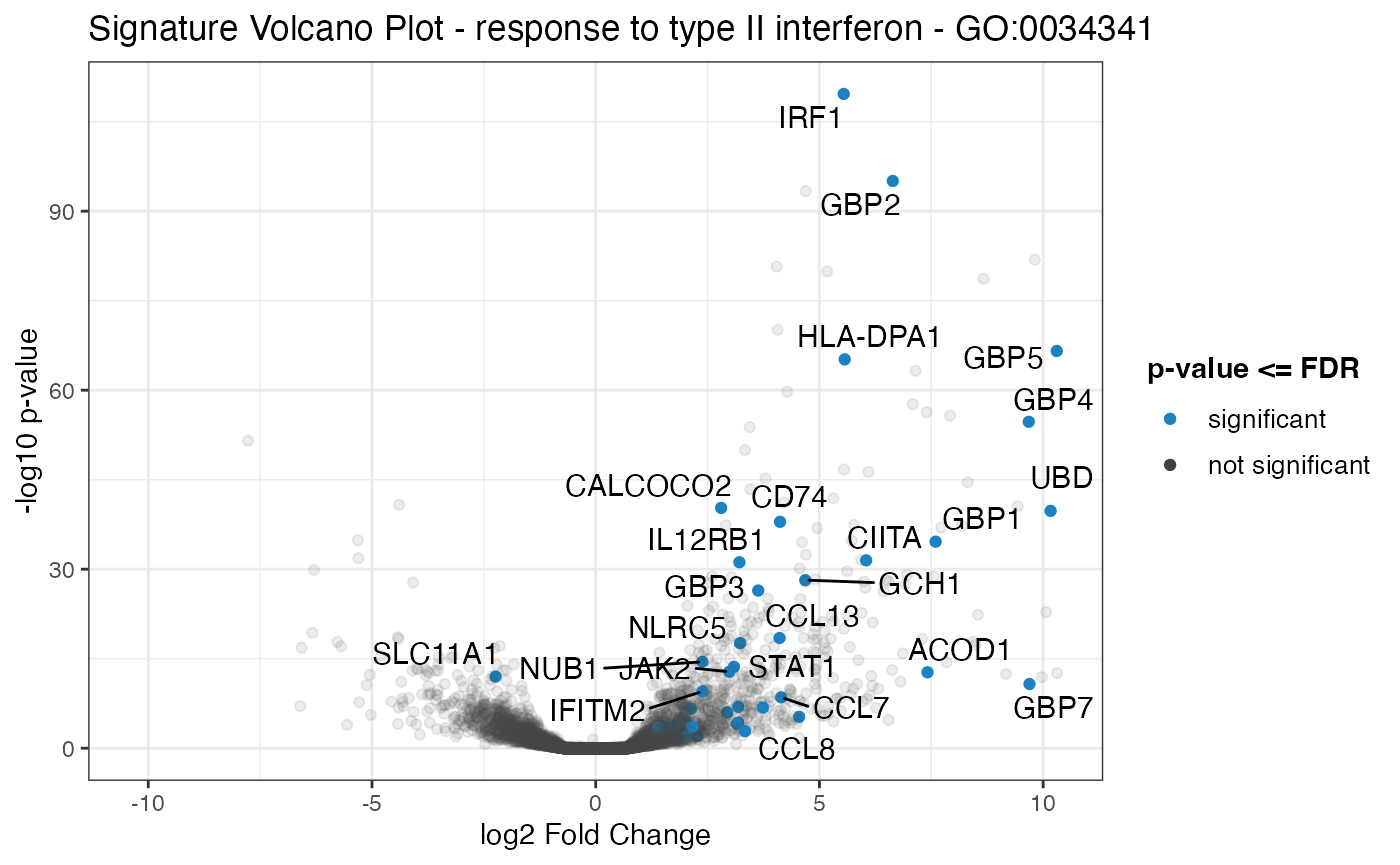
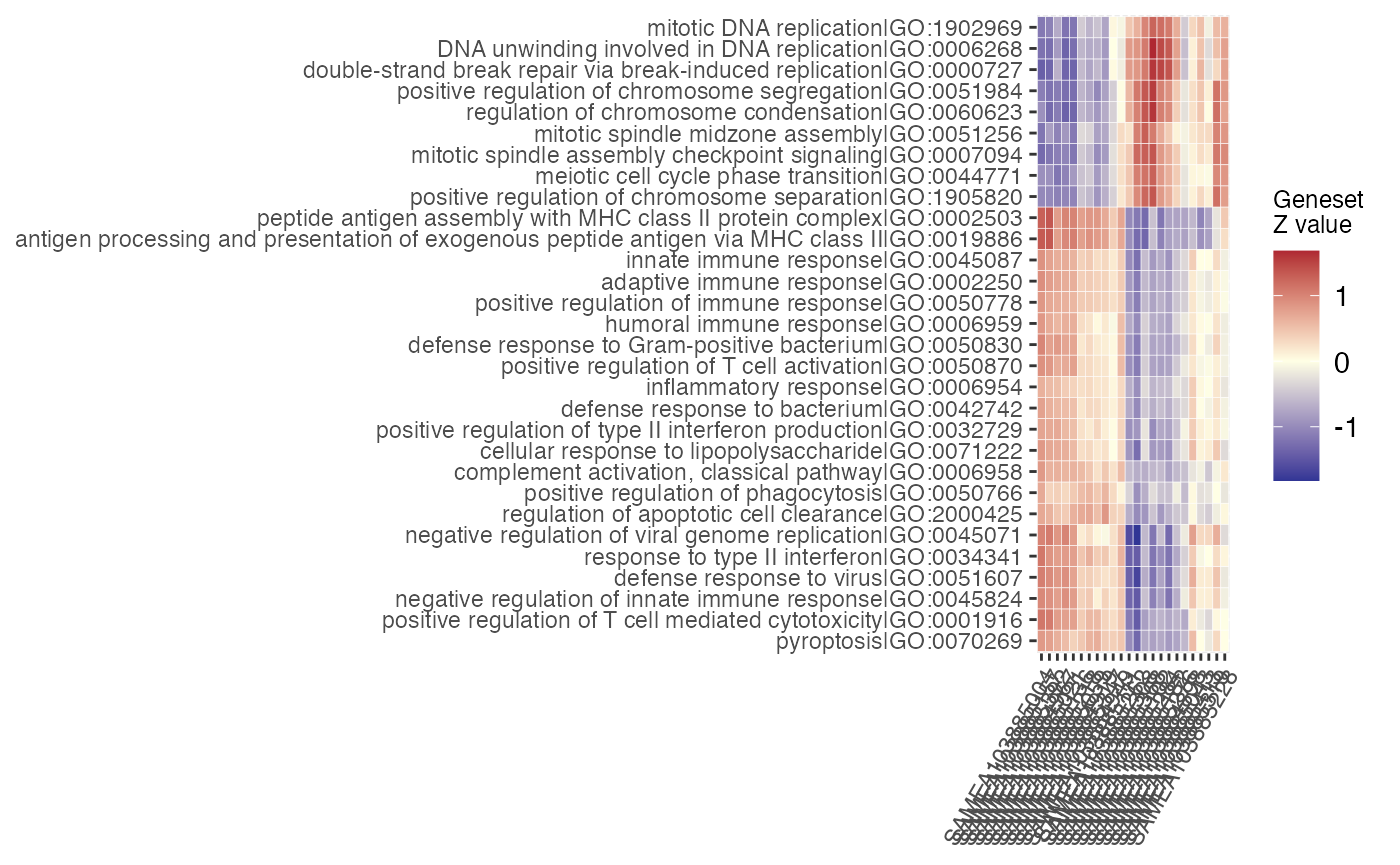
gs_scoresheat(
  mat = gs_scores(
    se = vst_macrophage,
    gtl = gtl_macs_ifng_naive),
  n_gs = 30
)
exporting them all
exportr(myresuSet_macrophage,
        out_file_prefix = "fedetest", out_folder = "dirtest")
#> Exporting the whole set for fedetest
#>     fedetest  ---  condition_IFNg_vs_naive
#>         Exporting results from DESeq...
#>           dirtest/fedetest_condition_IFNg_vs_naive_tbl_res_DESeq.xlsx
#>         Exporting results from topGO...
#>           dirtest/fedetest_condition_IFNg_vs_naive_tbl_topGOres.xlsx
#>         Exporting results from clusterProfiler...
#>           dirtest/fedetest_condition_IFNg_vs_naive_tbl_cluPro.xlsx
#>     fedetest  ---  ifng-naive-lfc0.6
#>         Exporting results from DESeq...
#>           dirtest/fedetest_ifng-naive-lfc0.6_tbl_res_DESeq.xlsx
#>         Exporting results from topGO...
#>           dirtest/fedetest_ifng-naive-lfc0.6_tbl_topGOres.xlsx
#>         Exporting results from clusterProfiler...
#>           dirtest/fedetest_ifng-naive-lfc0.6_tbl_cluPro.xlsx
#>     fedetest  ---  ifng-naive-lfc1
#>         Exporting results from DESeq...
#>           dirtest/fedetest_ifng-naive-lfc1_tbl_res_DESeq.xlsx
#>         Exporting results from topGO...
#>           dirtest/fedetest_ifng-naive-lfc1_tbl_topGOres.xlsx
#>         Exporting results from clusterProfiler...
#>           dirtest/fedetest_ifng-naive-lfc1_tbl_cluPro.xlsx
Session information
# BiocManager::version()
sessionInfo()
#> R version 4.5.0 Patched (2025-04-15 r88147)
#> Platform: aarch64-apple-darwin20
#> Running under: macOS Sonoma 14.7.4
#>
#> Matrix products: default
#> BLAS:   /Library/Frameworks/R.framework/Versions/4.5-arm64/Resources/lib/libRblas.0.dylib
#> LAPACK: /Library/Frameworks/R.framework/Versions/4.5-arm64/Resources/lib/libRlapack.dylib;  LAPACK version 3.12.1
#>
#> locale:
#> [1] en_US.UTF-8/en_US.UTF-8/en_US.UTF-8/C/en_US.UTF-8/en_US.UTF-8
#>
#> time zone: UTC
#> tzcode source: internal
#>
#> attached base packages:
#> [1] stats4    stats     graphics  grDevices utils     datasets  methods
#> [8] base
#>
#> other attached packages:
#>  [1] clusterProfiler_4.15.2      biomaRt_2.63.3
#>  [3] macrophage_1.23.0           ideal_2.1.1
#>  [5] pcaExplorer_3.1.1           GeneTonic_3.1.2
#>  [7] org.Hs.eg.db_3.21.0         topGO_2.59.0
#>  [9] SparseM_1.84-2              GO.db_3.21.0
#> [11] AnnotationDbi_1.69.1        graph_1.85.3
#> [13] DESeq2_1.47.5               SummarizedExperiment_1.37.0
#> [15] Biobase_2.67.0              MatrixGenerics_1.19.1
#> [17] matrixStats_1.5.0           GenomicRanges_1.59.1
#> [19] GenomeInfoDb_1.43.4         IRanges_2.41.3
#> [21] S4Vectors_0.45.4            BiocGenerics_0.53.6
#> [23] generics_0.1.3              BIUMmisc_0.2.0
#>
#> loaded via a namespace (and not attached):
#>   [1] fs_1.6.6                 bitops_1.0-9             enrichplot_1.27.5
#>   [4] webshot_0.5.5            httr_1.4.7               RColorBrewer_1.1-3
#>   [7] doParallel_1.0.17        numDeriv_2016.8-1.1      Rgraphviz_2.51.9
#>  [10] dynamicTreeCut_1.63-1    tippy_0.1.0              tools_4.5.0
#>  [13] R6_2.6.1                 DT_0.33                  lazyeval_0.2.2
#>  [16] mgcv_1.9-3               apeglm_1.29.0            GetoptLong_1.0.5
#>  [19] withr_3.0.2              prettyunits_1.2.0        gridExtra_2.3
#>  [22] fdrtool_1.2.18           cli_3.6.4                textshaping_1.0.0
#>  [25] TSP_1.2-4                labeling_0.4.3           slam_0.1-55
#>  [28] sass_0.4.10              bs4Dash_2.3.4            mvtnorm_1.3-3
#>  [31] genefilter_1.89.0        ggridges_0.5.6           goseq_1.59.0
#>  [34] pkgdown_2.1.1.9000       Rsamtools_2.23.1         systemfonts_1.2.2
#>  [37] yulab.utils_0.2.0        gson_0.1.0               txdbmaker_1.3.1
#>  [40] DOSE_4.1.0               R.utils_2.13.0           rentrez_1.2.3
#>  [43] AnnotationForge_1.49.1   sessioninfo_1.2.3        bbmle_1.0.25.1
#>  [46] limma_3.63.13            rstudioapi_0.17.1        RSQLite_2.3.9
#>  [49] GOstats_2.73.0           visNetwork_2.1.2         gridGraphics_0.5-1
#>  [52] shape_1.4.6.1            BiocIO_1.17.2            gtools_3.9.5
#>  [55] crosstalk_1.2.1          dplyr_1.1.4              dendextend_1.19.0
#>  [58] Matrix_1.7-3             abind_1.4-8              R.methodsS3_1.8.2
#>  [61] lifecycle_1.0.4          yaml_2.3.10              gplots_3.2.0
#>  [64] qvalue_2.39.0            SparseArray_1.7.7        BiocFileCache_2.15.1
#>  [67] grid_4.5.0               blob_1.2.4               promises_1.3.2
#>  [70] bdsmatrix_1.3-7          crayon_1.5.3             shinydashboard_0.7.2
#>  [73] miniUI_0.1.1.1           ggtangle_0.0.6           lattice_0.22-7
#>  [76] ComplexUpset_1.3.3       cowplot_1.1.3            annotate_1.85.0
#>  [79] GenomicFeatures_1.59.1   KEGGREST_1.47.1          pillar_1.10.2
#>  [82] knitr_1.50               ComplexHeatmap_2.23.1    fgsea_1.33.4
#>  [85] rjson_0.2.23             codetools_0.2-20         fastmatch_1.1-6
#>  [88] glue_1.8.0               ggfun_0.1.8              data.table_1.17.0
#>  [91] vctrs_0.6.5              png_0.1-8                treeio_1.31.0
#>  [94] gtable_0.3.6             assertthat_0.2.1         emdbook_1.3.13
#>  [97] cachem_1.1.0             xfun_0.52                S4Arrays_1.7.3
#> [100] mime_0.13                coda_0.19-4.1            survival_3.8-3
#> [103] pheatmap_1.0.12          seriation_1.5.7          iterators_1.0.14
#> [106] statmod_1.5.0            Category_2.73.0          nlme_3.1-168
#> [109] ggtree_3.15.0            bit64_4.6.0-1            threejs_0.3.3
#> [112] progress_1.2.3           filelock_1.0.3           UpSetR_1.4.0
#> [115] bslib_0.9.0              KernSmooth_2.23-26       colorspace_2.1-1
#> [118] DBI_1.2.3                tidyselect_1.2.1         bit_4.6.0
#> [121] compiler_4.5.0           curl_6.2.2               httr2_1.1.2
#> [124] BiasedUrn_2.0.12         expm_1.0-0               xml2_1.3.8
#> [127] desc_1.4.3               DelayedArray_0.33.6      plotly_4.10.4
#> [130] colourpicker_1.3.0       rtracklayer_1.67.1       caTools_1.18.3
#> [133] scales_1.3.0             mosdef_1.3.1             RBGL_1.83.0
#> [136] NMF_0.28                 rappdirs_0.3.3           stringr_1.5.1
#> [139] digest_0.6.37            shinyBS_0.61.1           rmarkdown_2.29
#> [142] ca_0.71.1                XVector_0.47.2           htmltools_0.5.8.1
#> [145] pkgconfig_2.0.3          base64enc_0.1-3          lpsymphony_1.35.1
#> [148] dbplyr_2.5.0             fastmap_1.2.0            rlang_1.1.6
#> [151] GlobalOptions_0.1.2      htmlwidgets_1.6.4        UCSC.utils_1.3.1
#> [154] shiny_1.10.0             farver_2.1.2             jquerylib_0.1.4
#> [157] IHW_1.35.0               jsonlite_2.0.0           BiocParallel_1.41.5
#> [160] GOSemSim_2.33.0          R.oo_1.27.0              RCurl_1.98-1.17
#> [163] magrittr_2.0.3           GenomeInfoDbData_1.2.14  ggplotify_0.1.2
#> [166] patchwork_1.3.0          munsell_0.5.1            Rcpp_1.0.14
#> [169] ape_5.8-1                shinycssloaders_1.1.0    viridis_0.6.5
#> [172] stringi_1.8.7            rintrojs_0.3.4           MASS_7.3-65
#> [175] plyr_1.8.9               parallel_4.5.0           ggrepel_0.9.6
#> [178] Biostrings_2.75.4        splines_4.5.0            hms_1.1.3
#> [181] geneLenDataBase_1.43.0   circlize_0.4.16          locfit_1.5-9.12
#> [184] igraph_2.1.4             rngtools_1.5.2           reshape2_1.4.4
#> [187] XML_3.99-0.18            evaluate_1.0.3           BiocManager_1.30.25
#> [190] foreach_1.5.2            tweenr_2.0.3             httpuv_1.6.16
#> [193] backbone_2.1.4           tidyr_1.3.1              purrr_1.0.4
#> [196] polyclip_1.10-7          heatmaply_1.5.0          clue_0.3-66
#> [199] ggplot2_3.5.2            gridBase_0.4-7           ggforce_0.4.2
#> [202] xtable_1.8-4             restfulr_0.0.15          tidytree_0.4.6
#> [205] later_1.4.2              viridisLite_0.4.2        ragg_1.4.0
#> [208] tibble_3.2.1             aplot_0.2.5              registry_0.5-1
#> [211] memoise_2.0.1            GenomicAlignments_1.43.0 writexl_1.5.4
#> [214] cluster_2.1.8.1          shinyWidgets_0.9.0       GSEABase_1.69.1
#> [217] shinyAce_0.4.4