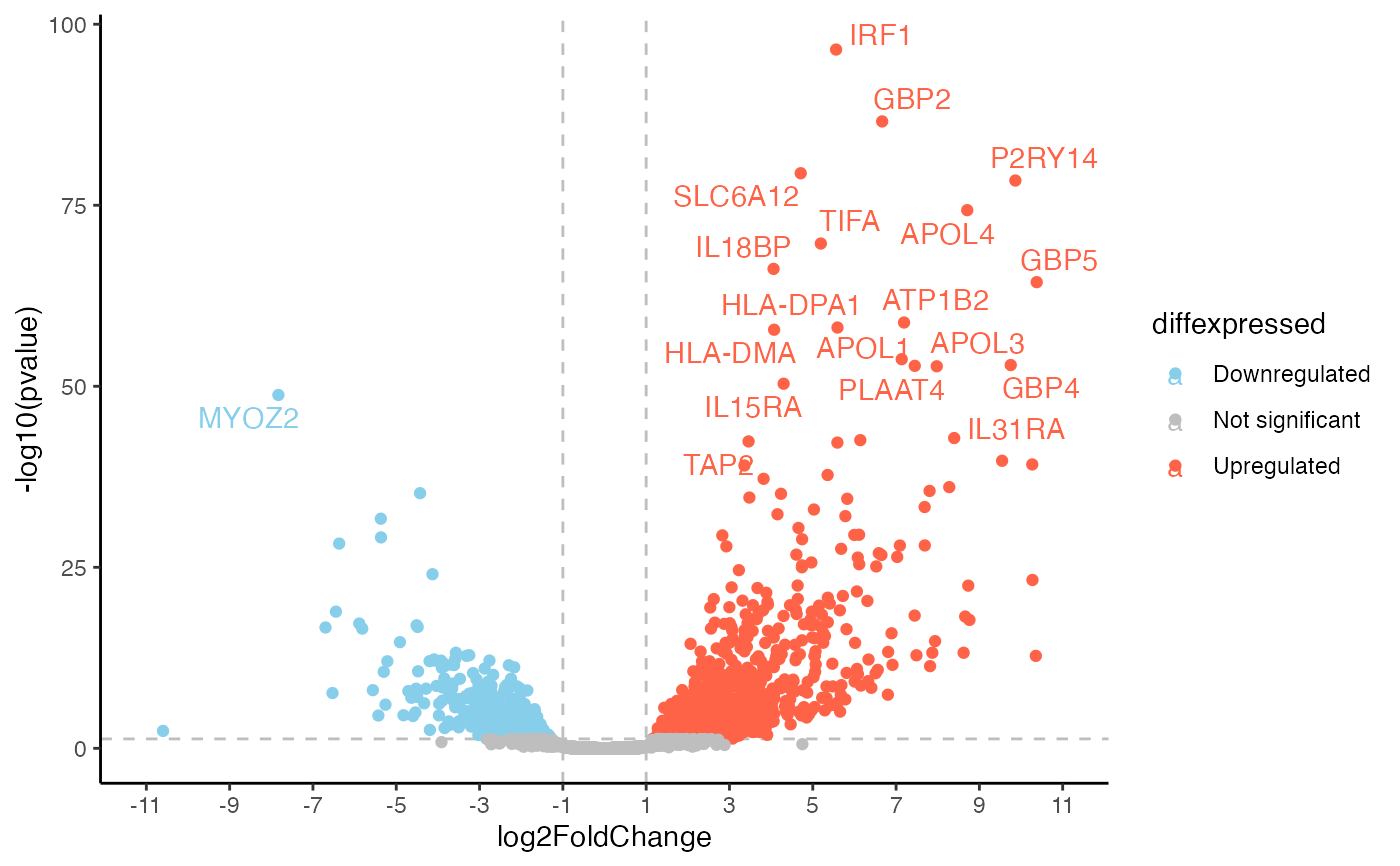
This function generates a base volcanoplot for differentially expressed genes that can then be expanded upon using further ggplot functions.
Usage
de_volcano(
  res_de,
  mapping = "org.Mm.eg.db",
  logfc_cutoff = 0,
  FDR = 0.05,
  draw_FDR_line = FALSE,
  labeled_genes = 30
)
Arguments
- res_de
An object containing the results of the Differential Expression analysis workflow (e.g.
DESeq2,edgeRorlimma). Currently, this can be aDESeqResultsobject created using theDESeq2framework.- mapping
Which
org.XX.eg.dbpackage to use for annotation - select according to the species- logfc_cutoff
A numeric value that sets the cutoff for the xintercept argument of ggplot. Defaults to 0.
- FDR
The pvalue threshold to us for counting genes as de and therefore also where to draw the line in the plot. Default is 0.05
- draw_FDR_line
Logical, whether to draw a line at the p-value corresponding to the specified FDR. Defaults to FALSE.
- labeled_genes
A numeric value describing the amount of genes to be labeled. This uses the Top(x) highest differentially expressed genes
Examples
library("ggplot2")
library("RColorBrewer")
library("ggrepel")
library("DESeq2")
#> Loading required package: S4Vectors
#> Loading required package: stats4
#> Loading required package: BiocGenerics
#> Loading required package: generics
#>
#> Attaching package: ‘generics’
#> The following objects are masked from ‘package:base’:
#>
#>     as.difftime, as.factor, as.ordered, intersect, is.element, setdiff,
#>     setequal, union
#>
#> Attaching package: ‘BiocGenerics’
#> The following objects are masked from ‘package:stats’:
#>
#>     IQR, mad, sd, var, xtabs
#> The following objects are masked from ‘package:base’:
#>
#>     Filter, Find, Map, Position, Reduce, anyDuplicated, aperm, append,
#>     as.data.frame, basename, cbind, colnames, dirname, do.call,
#>     duplicated, eval, evalq, get, grep, grepl, is.unsorted, lapply,
#>     mapply, match, mget, order, paste, pmax, pmax.int, pmin, pmin.int,
#>     rank, rbind, rownames, sapply, saveRDS, table, tapply, unique,
#>     unsplit, which.max, which.min
#>
#> Attaching package: ‘S4Vectors’
#> The following object is masked from ‘package:utils’:
#>
#>     findMatches
#> The following objects are masked from ‘package:base’:
#>
#>     I, expand.grid, unname
#> Loading required package: IRanges
#> Loading required package: GenomicRanges
#> Loading required package: GenomeInfoDb
#> Loading required package: SummarizedExperiment
#> Loading required package: MatrixGenerics
#> Loading required package: matrixStats
#>
#> Attaching package: ‘MatrixGenerics’
#> The following objects are masked from ‘package:matrixStats’:
#>
#>     colAlls, colAnyNAs, colAnys, colAvgsPerRowSet, colCollapse,
#>     colCounts, colCummaxs, colCummins, colCumprods, colCumsums,
#>     colDiffs, colIQRDiffs, colIQRs, colLogSumExps, colMadDiffs,
#>     colMads, colMaxs, colMeans2, colMedians, colMins, colOrderStats,
#>     colProds, colQuantiles, colRanges, colRanks, colSdDiffs, colSds,
#>     colSums2, colTabulates, colVarDiffs, colVars, colWeightedMads,
#>     colWeightedMeans, colWeightedMedians, colWeightedSds,
#>     colWeightedVars, rowAlls, rowAnyNAs, rowAnys, rowAvgsPerColSet,
#>     rowCollapse, rowCounts, rowCummaxs, rowCummins, rowCumprods,
#>     rowCumsums, rowDiffs, rowIQRDiffs, rowIQRs, rowLogSumExps,
#>     rowMadDiffs, rowMads, rowMaxs, rowMeans2, rowMedians, rowMins,
#>     rowOrderStats, rowProds, rowQuantiles, rowRanges, rowRanks,
#>     rowSdDiffs, rowSds, rowSums2, rowTabulates, rowVarDiffs, rowVars,
#>     rowWeightedMads, rowWeightedMeans, rowWeightedMedians,
#>     rowWeightedSds, rowWeightedVars
#> Loading required package: Biobase
#> Welcome to Bioconductor
#>
#>     Vignettes contain introductory material; view with
#>     'browseVignettes()'. To cite Bioconductor, see
#>     'citation("Biobase")', and for packages 'citation("pkgname")'.
#>
#> Attaching package: ‘Biobase’
#> The following object is masked from ‘package:MatrixGenerics’:
#>
#>     rowMedians
#> The following objects are masked from ‘package:matrixStats’:
#>
#>     anyMissing, rowMedians
library("org.Hs.eg.db")
#> Loading required package: AnnotationDbi
#>

data(res_de_macrophage, package = "mosdef")

p <- de_volcano(res_macrophage_IFNg_vs_naive,
  logfc_cutoff = 1,
  labeled_genes = 20,
  mapping = "org.Hs.eg.db"
)
#> 'select()' returned 1:many mapping between keys and columns

p
#> Warning: Removed 17787 rows containing missing values or values outside the scale range
#> (`geom_text_repel()`).